
Behind the scenes, we're always working hard to create the best possible experience for you. So when we got feedback from multiple people about their not always great experience when testing groups of people, we got to the bottom of it.
Estimated reading time: 3 minutes.
Improvements on the pitch
Waiting zones
An often recurring question was: where can the other athletes stand to not interfere with the detection? We’ve developed filters to guarantee some safe zones for the coach and other athletes alike. You’ll see for each test in the app that we’ve added waiting zones and walking back zones in the pictures.
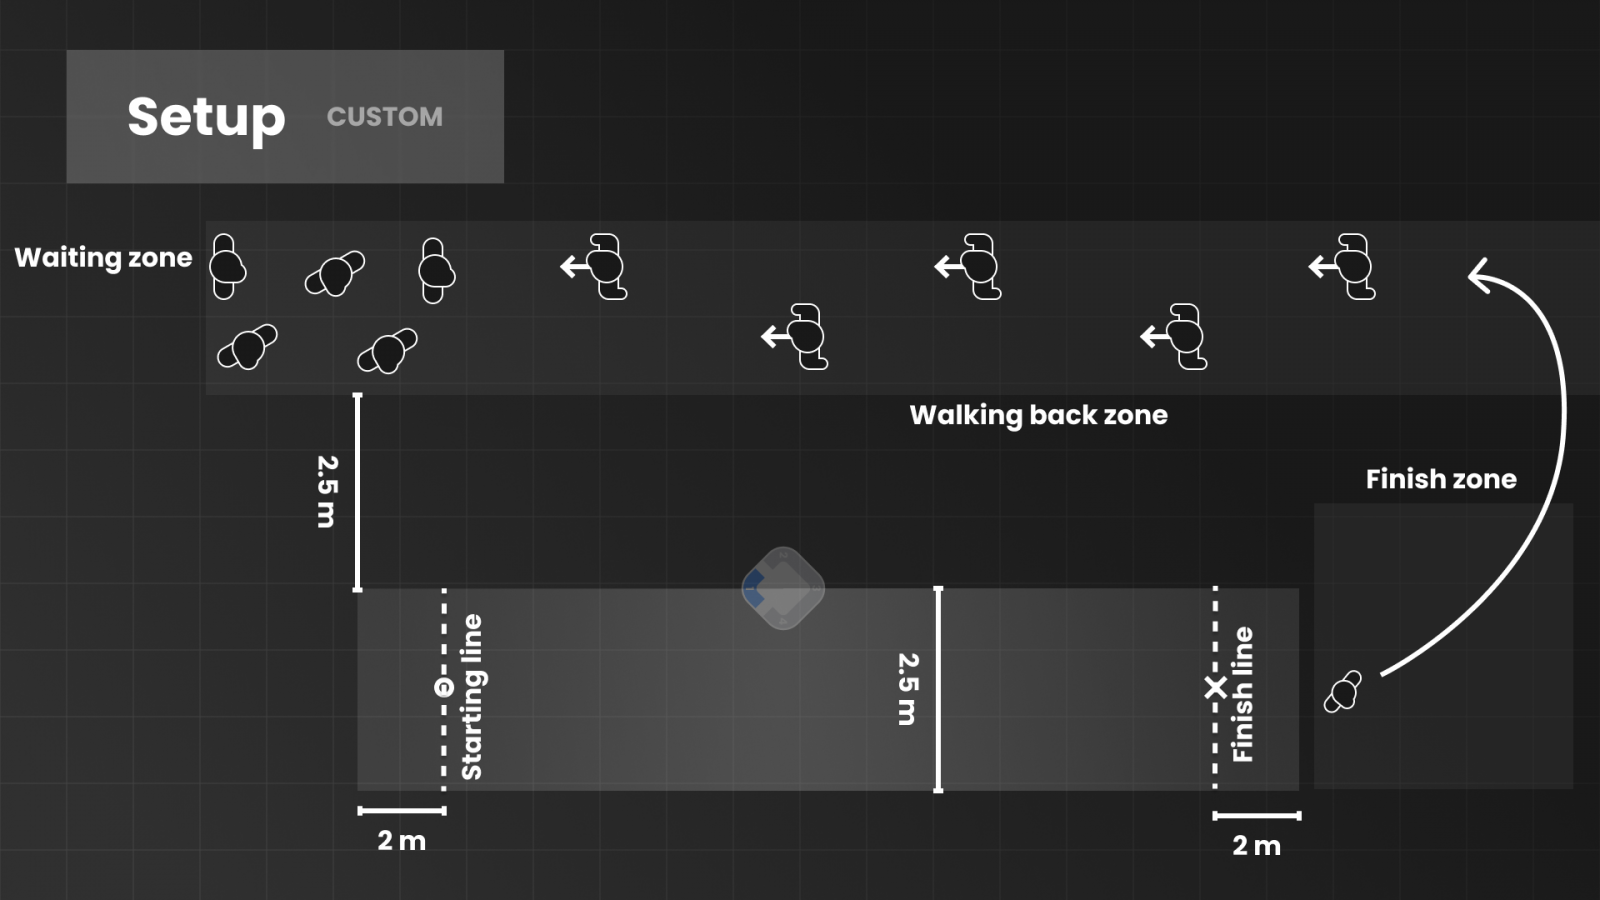
In implementing these zones, the successful completion of each athlete’s test has become more sure, to have a better experience testing groups of athletes one after the other.
New Play User Interface
In case something would go wrong with one person’s test (them not being ready, a faulty start, no green light etc), it’s possible to skip them with the new Play User Interface. Watch out, they don’t reappear so they have to be set up again.
The new Play User Interface also makes room for adding remarks on the test. They will automatically appear in the web platform for this test session so you can always note down what happened.
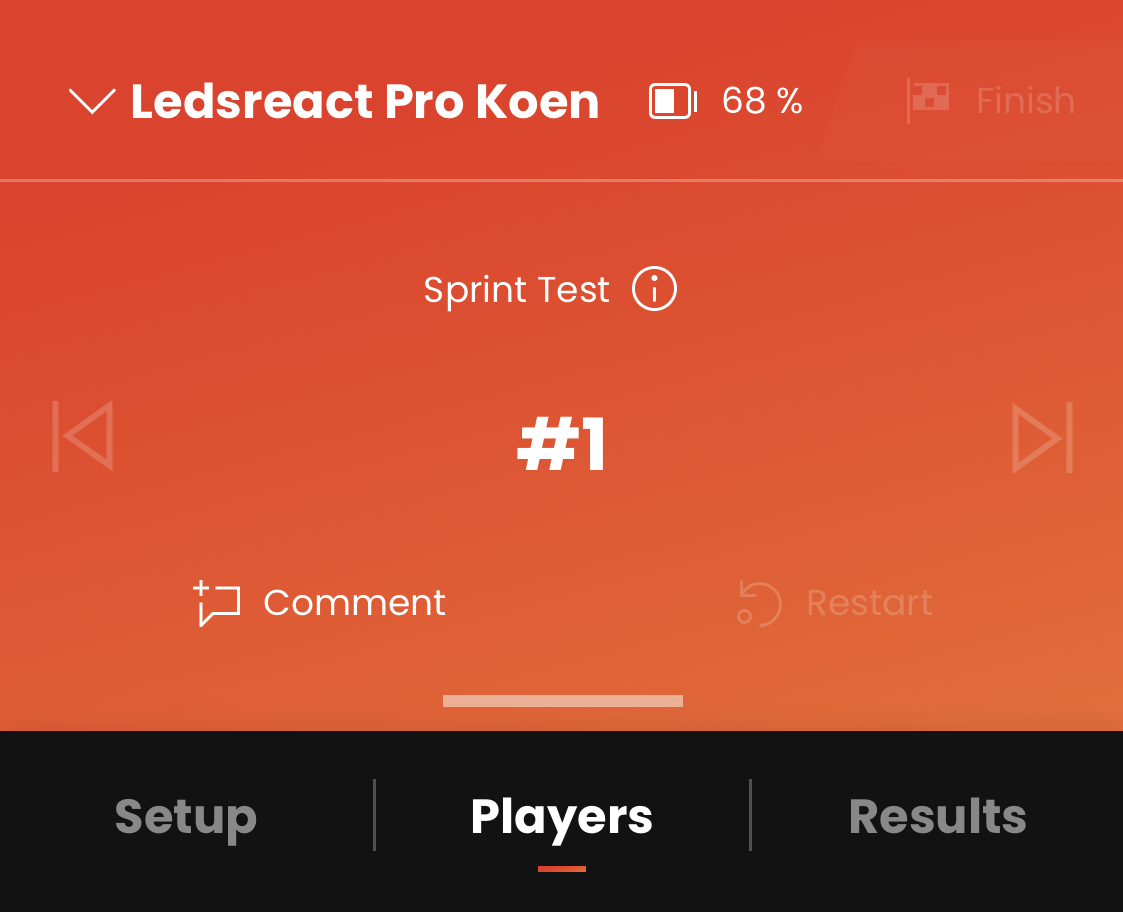
Furthermore, with the new Play User Interface the rhythm of testing lies more than ever in the hands of the coach.
You can decide if the testing of a group of athletes one after the other starts automatically (autostart), or if you are the one who decides when the next athlete can take their starting position.
You can also completely restart the test. This will make all players go again for this test setup.
It’s also become easier to view on the spot what the setup is for the exercise. You could change the number of attempts or which color signal your athlete gets (in a 5-10-5 or a T-test), but changing other variables still requires creating a new exercise.
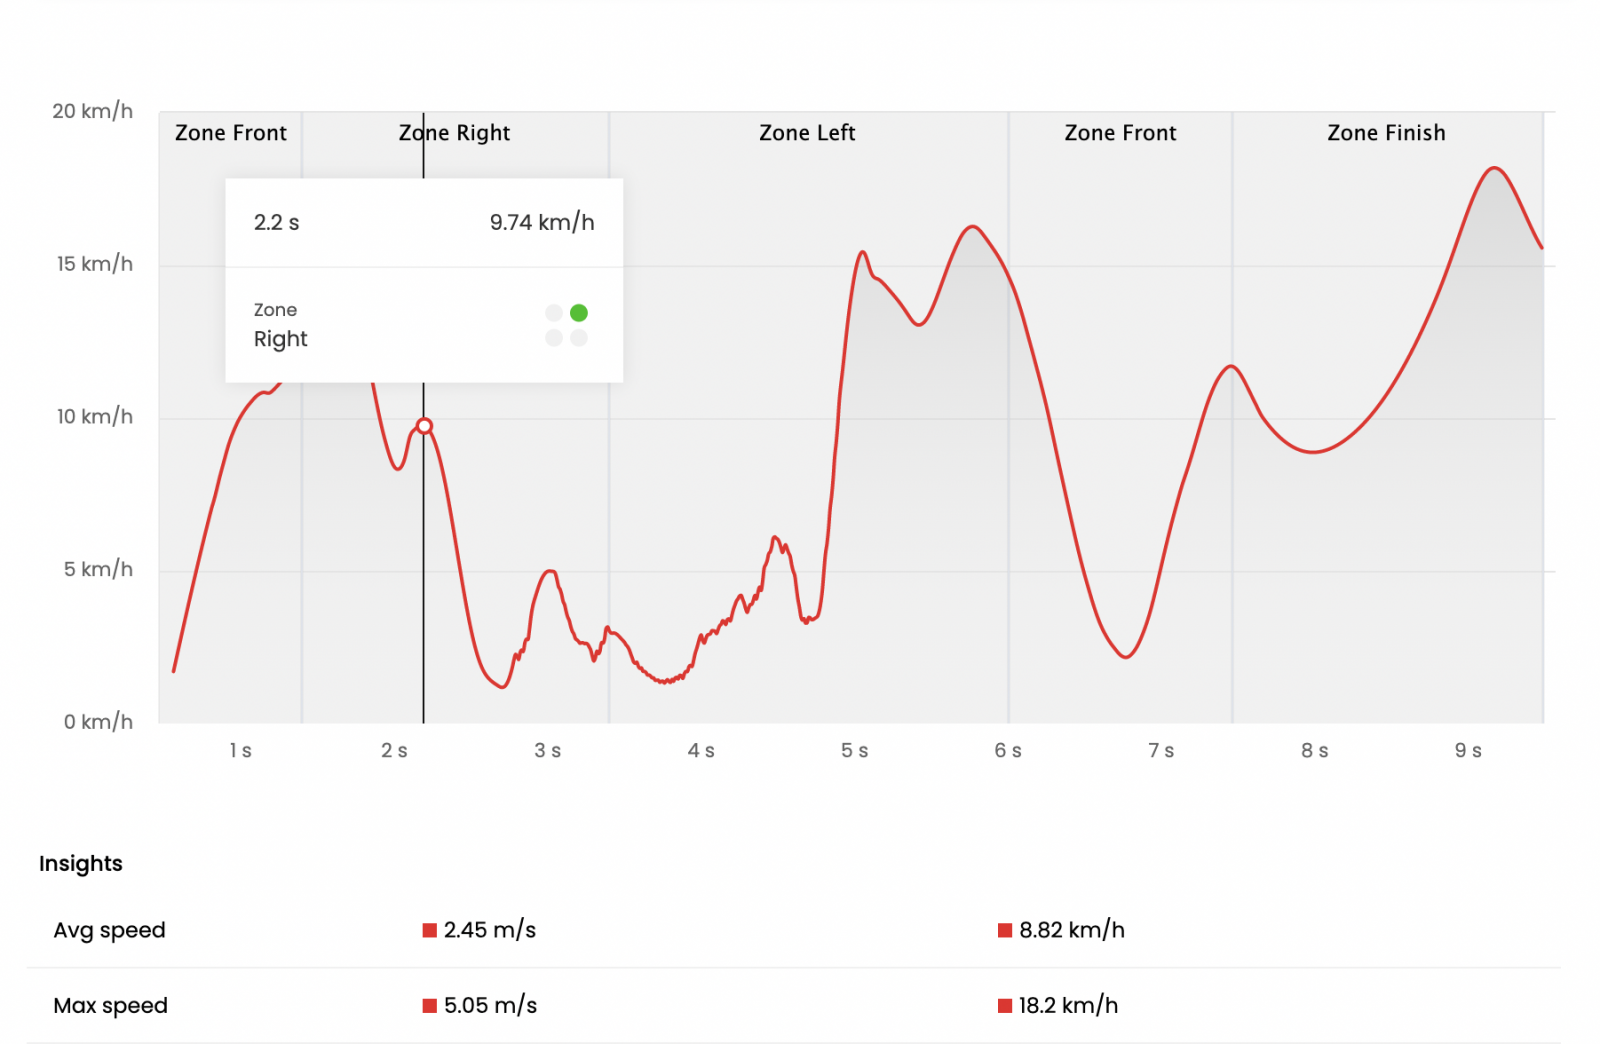
Reaction time becomes visible!
Further research in the raw data has allowed us to display the reaction time for all tests where the start position lies close to the Ledsreact Pro. The live data will still show you the total duration, including the reaction time, but in the web platform you’ll see an extra bar for the reaction time in the duration graph.
THE REACTION TIME IS DEFINED AS THE TIME BETWEEN GETTING THE SIGNAL AND THE FIRST MOVEMENT OF THE REAR FOOT.
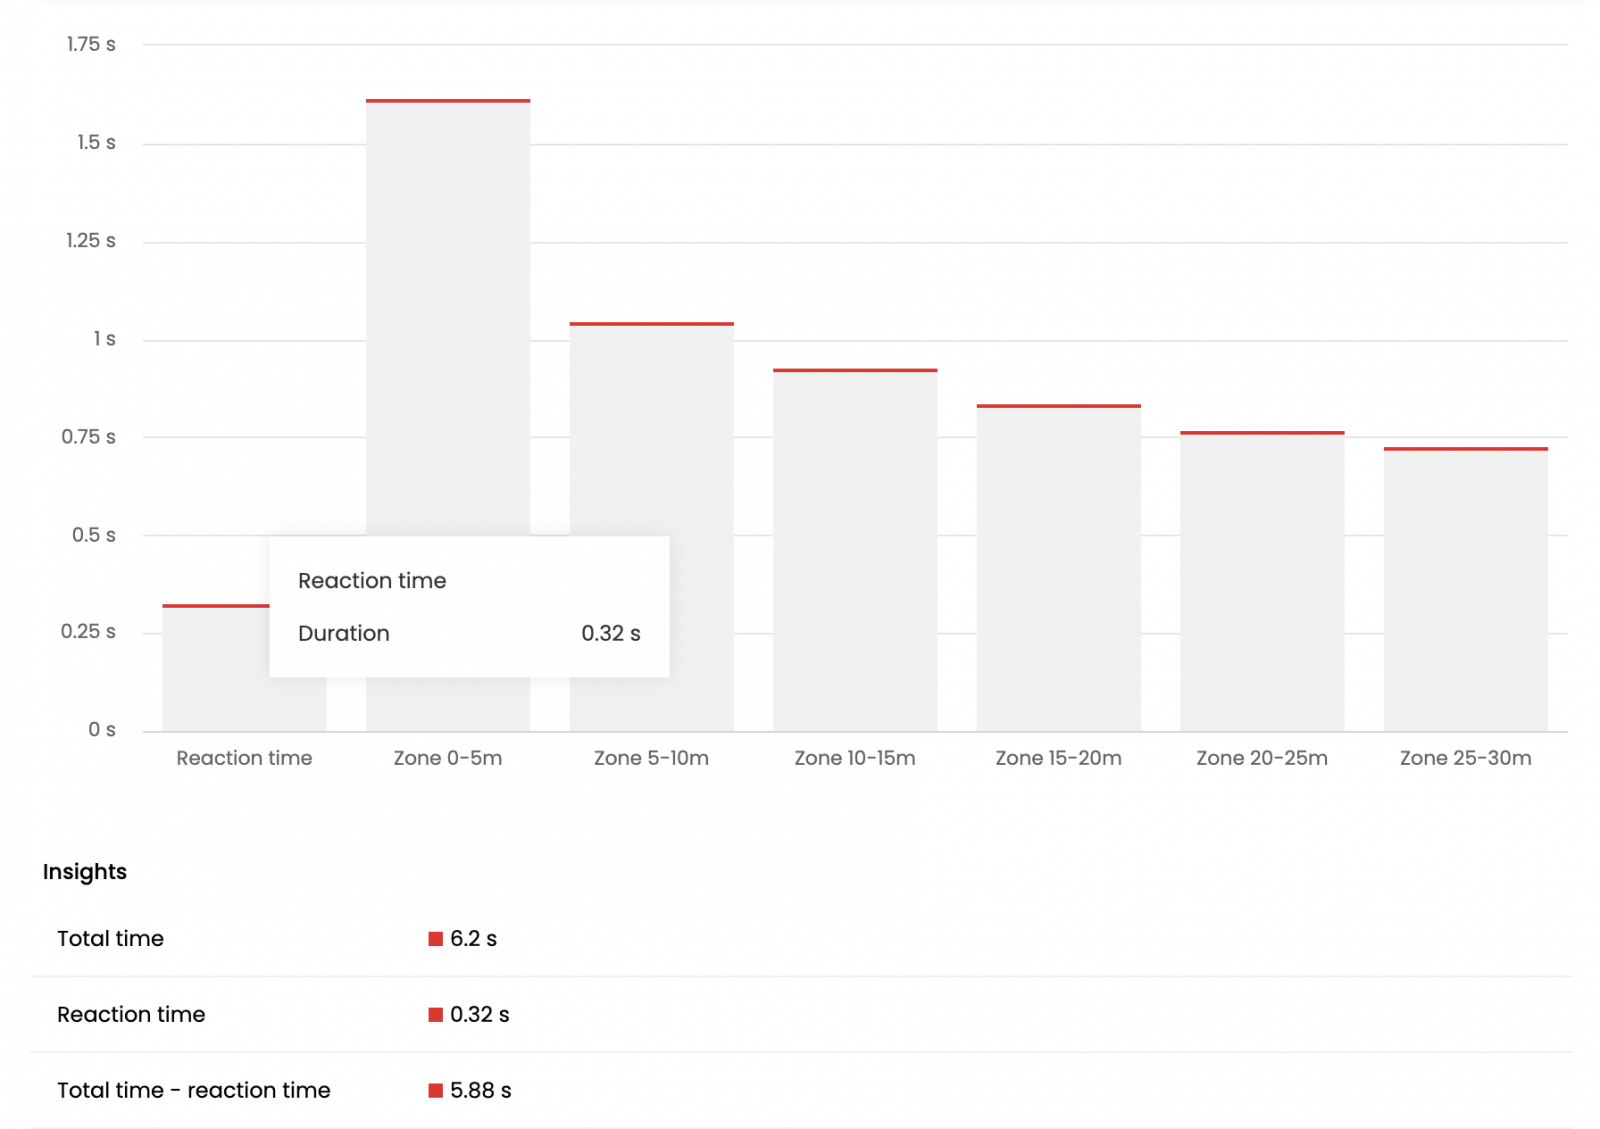
At the moment, you can see the reaction time for the Sprint Test, the Change of Direction Test and the Long Sprint Test as long as the starting point is placed no more than 5 meter from the Ledsreact Pro.
For a Long Sprint Test where you want to see the reaction time, the maximum distance is now still 25 meter: 5 meter from starting point to Ledsreact Pro and another 20 meter from Ledsreact Pro to the finish point.
Improvements on the screen
In the background several small but equally important changes have been made to the web platform and the app to make your life easier.
Support guide
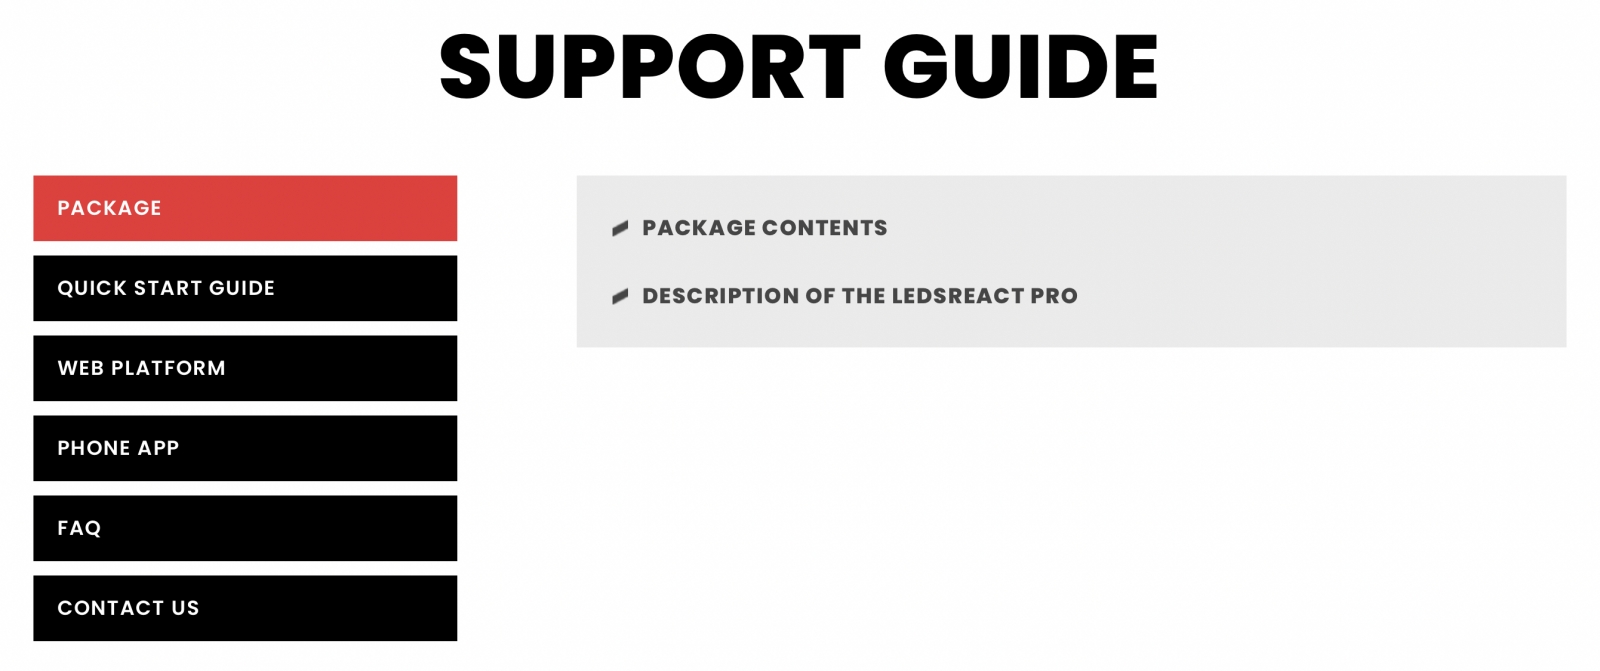
One of them is that the support button in the app and the web platform will lead you to a support guide and not directly towards emailing us. This will make it possible for you to find the solution faster in many cases. It's also always available from www.ledsreact.com/get-started-pro.
More informative Activity Log
The web platform has improved in clarity.
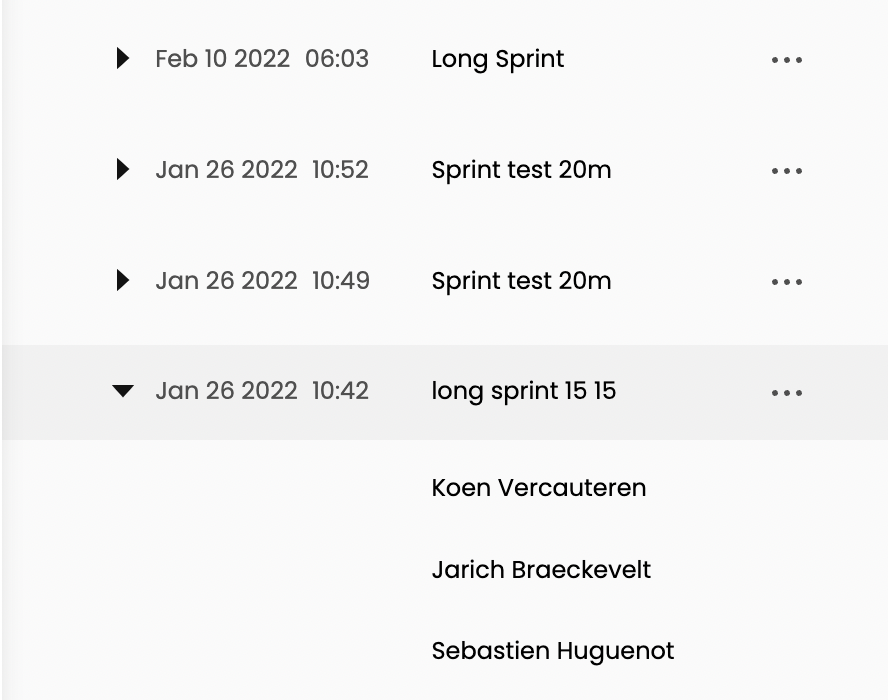
For example when viewing results in the Activity Log, the left column shows the names of the test that was performed so it’s easier to know which test moment you’re dealing with and to find back another one.
The graphs for the T-test and 5-10-5 now show the colors displayed by the Ledsreact Pro (like it was already the case for the Agility Box test) so you know which direction your athlete went first.
WiFi fix
Furthermore, connecting to WiFi networks shouldn’t cause an error anymore where the app told you the password was incorrect.