
In the previous blogpost "Force Velocity Power profile, part 1" we explained what the Force Velocity Power (FVP) profile exactly entails and why it can be advantageous when training groups for speed. This blogpost will dive deeper into the way the FVP profile is constructed and how you can interpret the FVP graphs to make better programming decisions.
Table of content
- How is my input modeled?
- What are the metrics connected to a Force Velocity Power profile?
- The different graphs in a Force Velocity Power profile
- What are normal values for these metrics?
- How do I interpret the Force Velocity Power (FVP) profile?
- Why should I use Force Velocity Power profiling?
- Limitation of Force Velocity Power profiling
- Conclusion
- References
How is my input modeled?
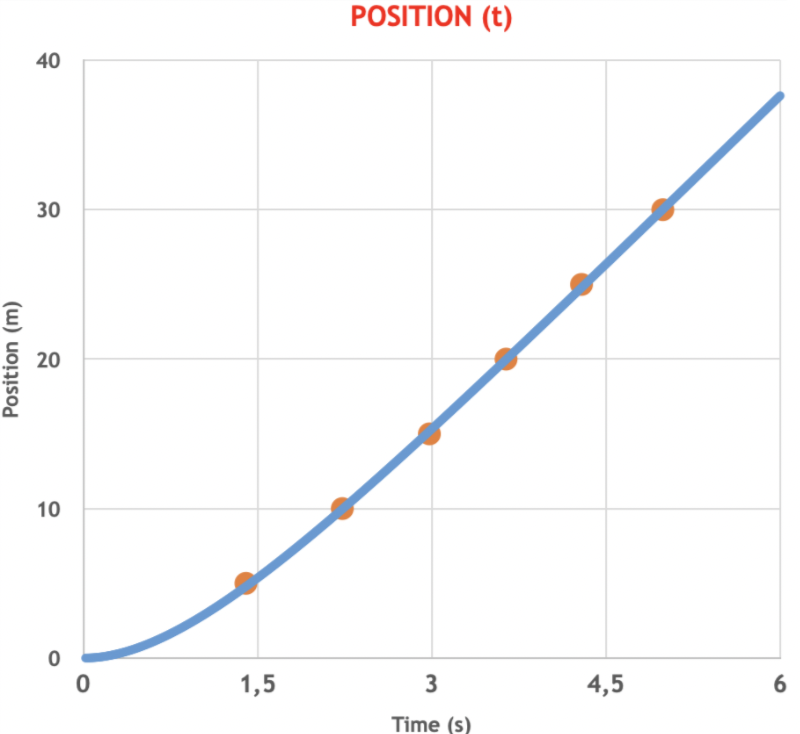
To calculate a FVP profile, you need your athletes to perform a sprint test of 20 to 40 meter (the athlete needs to reach maximal velocity) and capture at least 4 split times. Even better would be to capture the speed over time throughout the total run. Other parameters are the athlete's height and weight, the outside temperature and the air pressure.
After updating JB Morin's Excel spreadsheet with this input, the split times will be displayed as points on a graph of position over time. The spreadsheet will then attempt to fit a line through these points. The exponential equation of this line is modeled by two parameters: time constant Tau and maximal velocity Vmax. By doing many iterations with the Excel solver add-in to minimize the difference between the line and the actual data points, these two parameters are calculated. This process is clearly shown in JB Morin’s blog post.
Having calculated Tau and Vmax, the spreadsheet will automatically display the different graphs that give you a full view of your athlete’s Force Velocity Power profile and mechanical effectiveness.
If you are working with the Ledsreact Pro, the graph of speed over time is already included in the basic overview, seeing as position is tracked over time during the entire sprint effort. From here, the processing required to get the Force Velocity Profile is automatically done by the Ledsreact software.
These simple models have been validated against measurements with force plates (Samozino et al., 2015) (Morin et al., 2019) and proven that some simple inputs suffise to get good reliability in describing sprint movements.
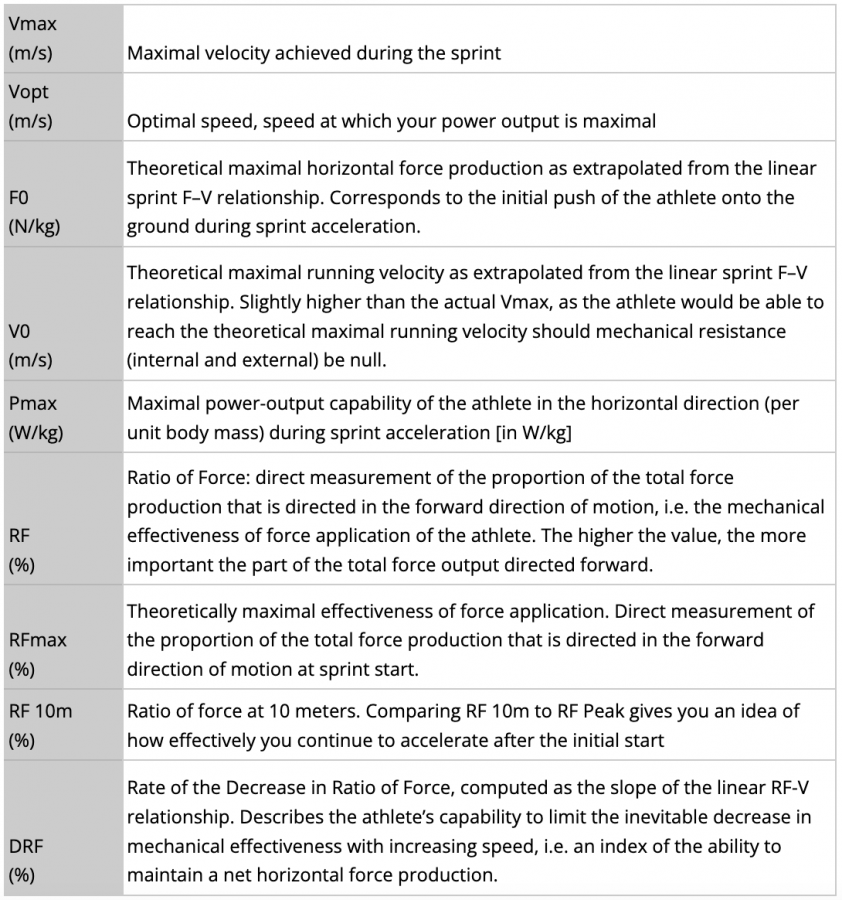
What are the metrics connected to a Force Velocity Power profile?
When you are taking a look at all the charts for the first time, you might get confused. These are some of the metrics which you should aim to understand and point out on the graphs. In the section “How do I interpret the FVP profile?”, we take a deeper look at this.
These metrics form the building blocks to make the right decisions based on your athlete’s FVP profile and they are the first step in designing a fully individualized training plan.
The different graphs in a Force Velocity Power Profile
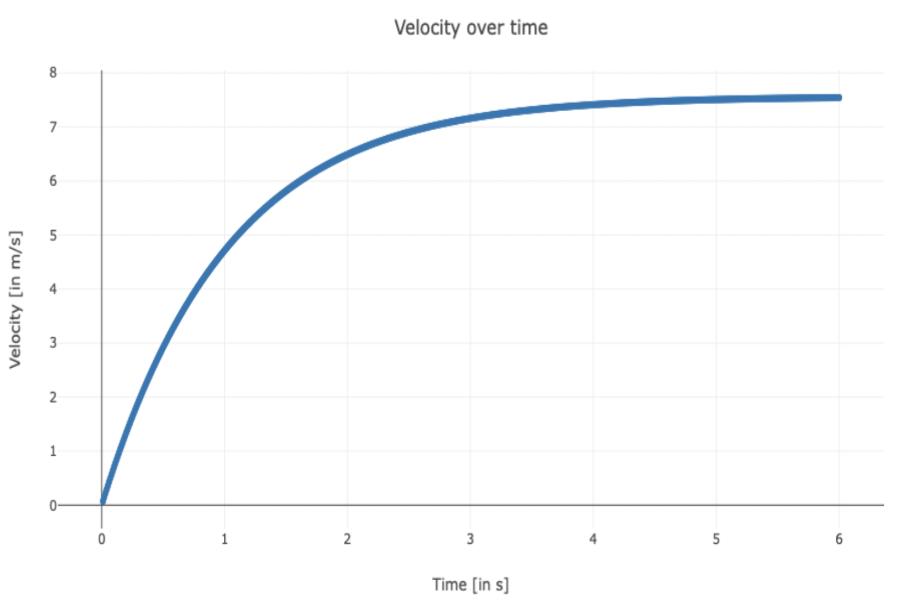
a) Velocity over time
The first graph that’s modeled is the velocity over time. It’s an exponential curve that uses the parameters Vmax and Tau, that were calculated in the previous step.
V (t) = Vmax (1 - e-t/tau)
b) Horizontal net force over time
Net force (in N/kg) over time shows us how much force the athlete can output during his sprint. The total horizontal net force is a combination of the horizontal force applied by the athlete and the air friction. The first one is calculated as the mass of the athlete multiplied with their horizontal acceleration. The second is calculated based on the air parameters and the area of the athlete the air presses on when sprinting.
Mathematically, that would be described as:
F hzt total = F hzt + F air = (a . m) + F air = ( ( Vmax/t . e -t/tau ) . m) + ( k . V2 )
with k representing a constant that collects the effects of air density, drag, and area of the object (kg/m).
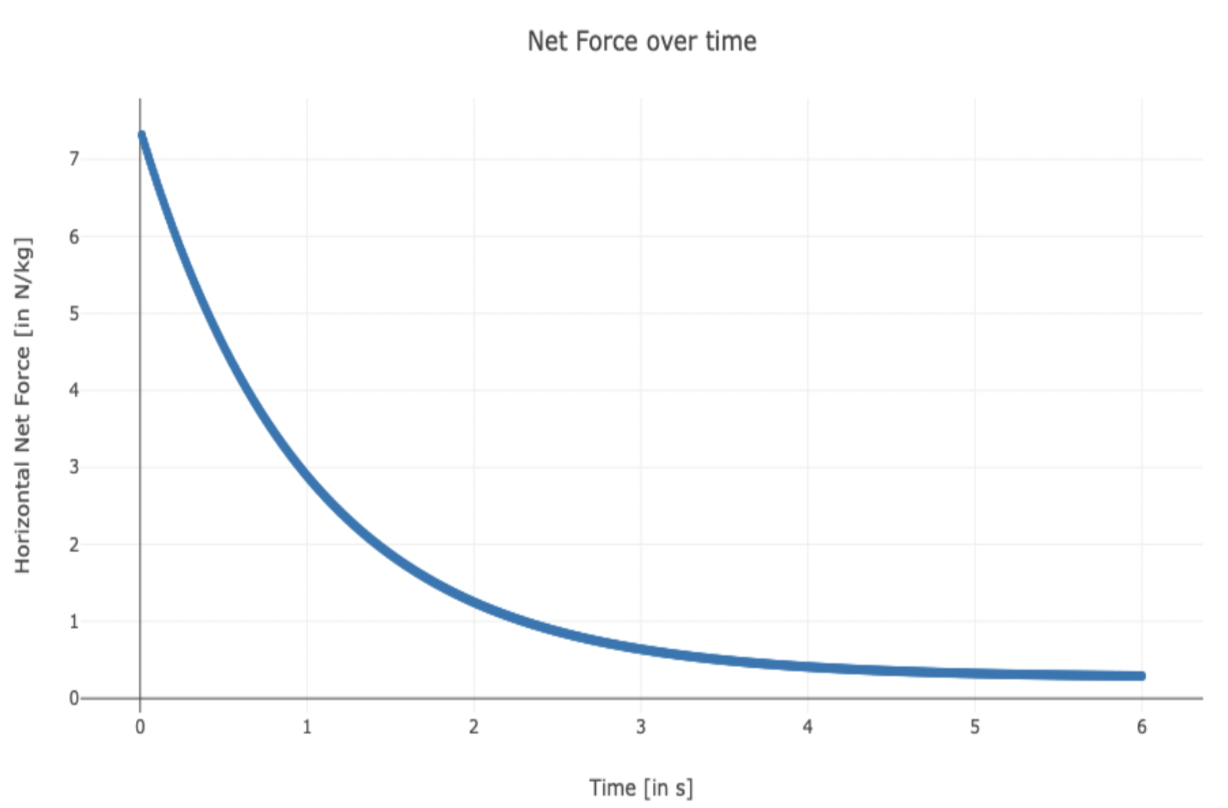
Acceleration is basically how your velocity changes over time. It makes sense that it’s maximal at the start, when you go from standstill to a sprint, and then goes down. We see the same thing reflected in the force over time, which tells us something about the drop-off rate, in other words how long the effort can be maintained.
c) External propulsive power over time
“Propulsive power” is the rate of change in kinetic energy of the center of mass over time, and has the dimension of a product of velocity and force produced in the running direction (forward). As time progresses, the velocity goes up and the force goes down. This means that power goes up to a maximum and diminishes over time.
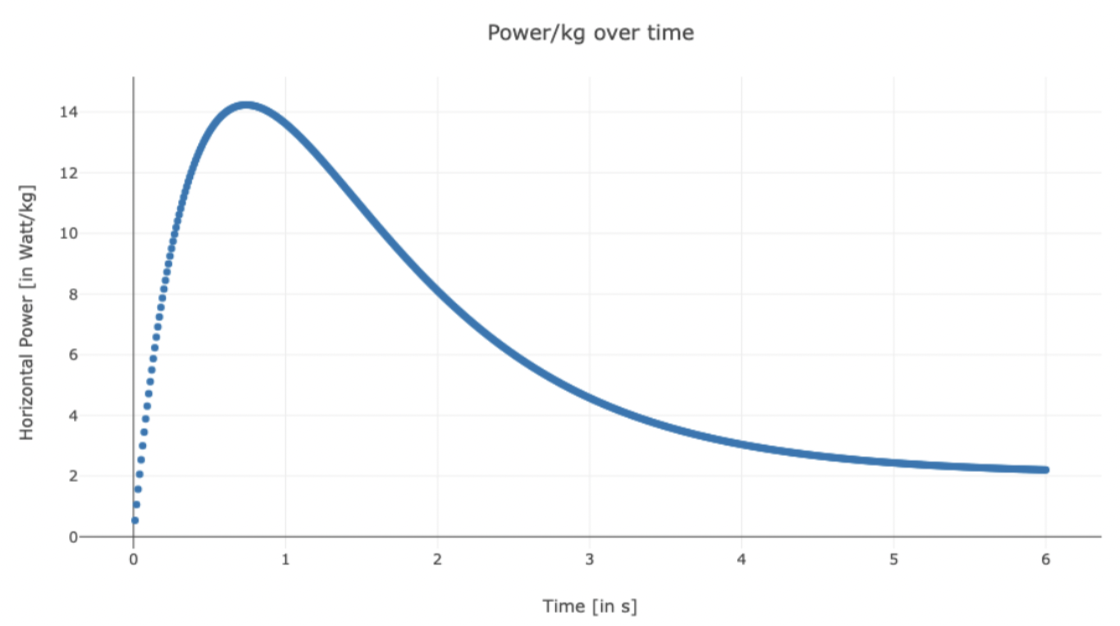
The most notable point on the external propulsive power (in W/kg) over time graph is the Pmax but it’s also interesting to compare these graphs between athletes to see the drop-off rate of the produced power. When the power declines faster it means that the athlete is not able to sustain the effort or is less effective mechanically as well which will lead to lower top speeds.
d) Force - Velocity - Power
This graph consists of two lines: the force over velocity and the power over velocity.
Force represents the Horizontal Net Force and is the addition of the athlete’s horizontal force applied and the air friction. The first one is calculated by multiplying the mass of the athlete by their horizontal acceleration. The second is calculated based on the air parameters and the exposed surface of the athlete.
The closer you reach your maximal velocity during the sprint, the more your acceleration goes to zero and since force is proportional to acceleration we see the force graph going down with the velocity as well.
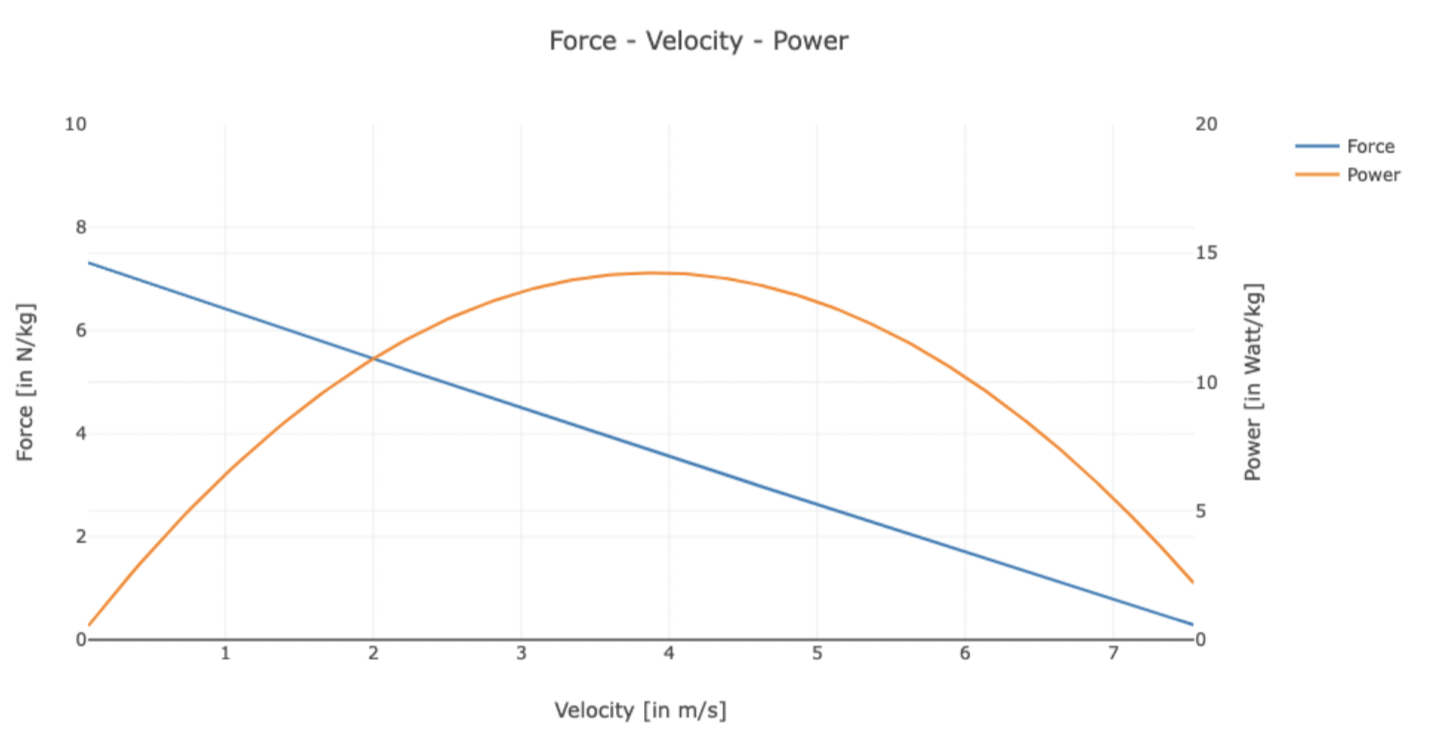
Simply put, power is the product of force and velocity. You can see that the power over time goes up since velocity is going up and then goes down with the declining force. The power curve naturally reaches a maximum where the power output is maximal, Pmax, and we call the velocity at this point the optimal velocity (Vopt). Note that this point is not the point where the highest velocity is reached (Vmax).
e) Ratio of Force over velocity
An important factor in an athlete’s sprint performance is their technical ability of force application (Morin et al., 2011). To move forwards, the body accelerates proportionally to the force applied AND in the direction of which that force is applied. In other words, proportionally to the horizontal force applied in the case of a sprint. The Mechanical Effectiveness is a real Key Performance Indicator (KPI) in sprinting.
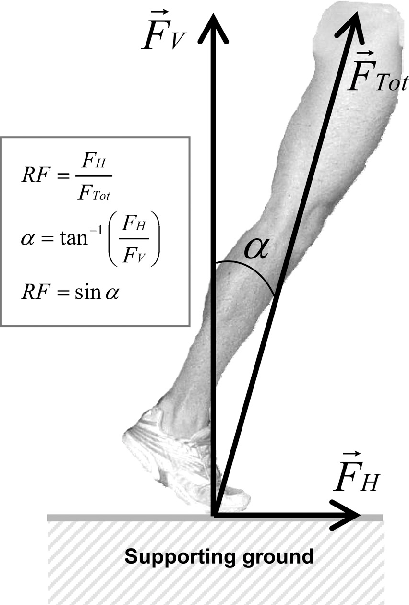
For each step that the athlete takes, there is a vertical force (gravity) and a total horizontal force (air friction and the horizontal force applied by the athlete) that result in a total force. To calculate the mechanical effectiveness of a sprint effort, we use the Ratio of Force. This is the horizontal force divided by the total force as averaged over a contact phase.
The Ratio of Force - Velocity graph shows how the ratio of force changes with the increasing velocity.
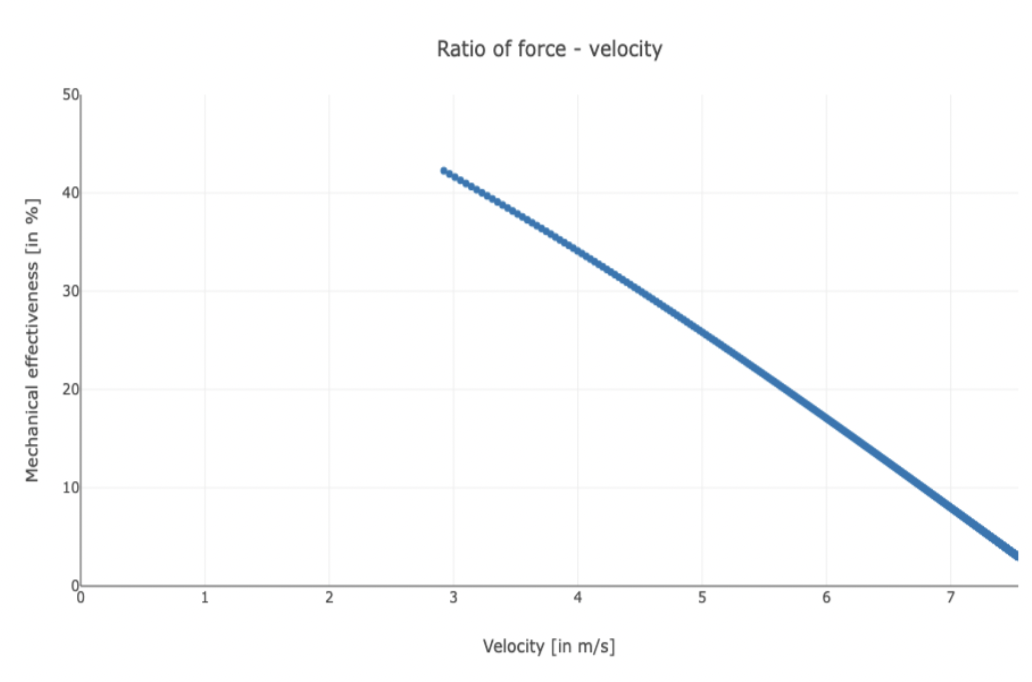
Step after step, this Ratio of Force decreases. The Decrease in Ratio of Force (DRF) is inevitable, the difference between athletes is made at which rate this decrease takes place. The DRF is thus an index of the propulsive effectiveness and can be found as the slope of the Ratio of Force over velocity.
Since an athlete already reaches 50% of their maximum velocity after 1 second (which is approximately 3 steps), you can recognize that the horizontal force at high velocity is of paramount importance.
What are normal values for these metrics?
This is a short table of normative values for the discussed metrics, based on JB Morin’s experience (Morin, 2017). The lower end values are physically active individuals with no experience, while the upper end values are for elite athletes.
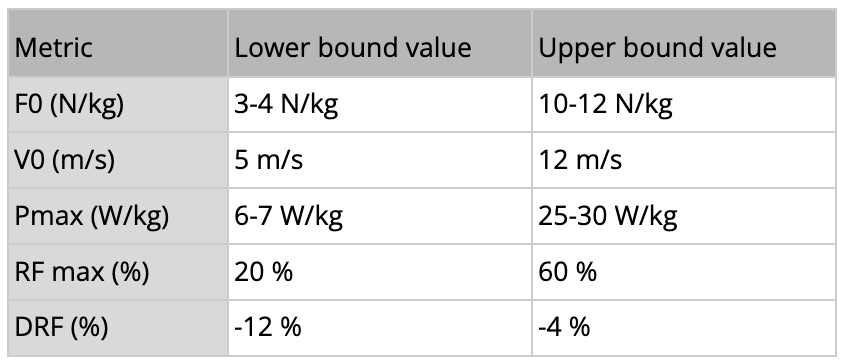
They can serve as a guideline to check if your measurements make sense. If your top level athletes are near the lower boundaries or if a non-trained individual produces values that you would normally expect in a top level athlete, this should ring an alarm bell and you should probably repeat the test. It’s always a good practice to do the sprint test at least three times to be able to filter one bad measurement out if necessary.
How do I interpret the Force Velocity Power (FVP) profile?
The full explanation of the Force Velocity Power profile is provided in a paper by Jean-Benoit Morin and Pierre Samozino (Morin et al., 2016). Here, we will use parts of this paper to explain the interpretation of the FVP and which actions you can take after acquiring the results and understanding the graphs.
Force-Velocity-Power graph
From the Force-Velocity line you can extrapolate the F0 and the V0, which are the theoretical maximal horizontal force production and the theoretical maximal running velocity. You can find F0 at the intersection of the graph with the vertical y-axis and V0 at the intersection of the graph with the horizontal x-axis.
Ideally, you’d want them to be rather balanced. If the value of F0 is much higher than the value of V0, you need to work on improving their maximal velocity. On the other hand, if the value of V0 outweighs the value of F0, you know your athlete has a force deficit and that you should address that in order to improve their sprint time.
Morin et al. also found out that the shorter the sprint, the stronger the relationship between sprint performance and maximal horizontal force production F0 is, and thus the more important improving your athlete’s force is.
By comparing the F0 and V0 values within your team you might be able to make groups of players that are within similar values and that you want to train each with a different training focus. For example if there is a group of athletes that needs to improve their V0, you can focus on high velocity exercises with them. Whereas a group of players with low F0 will need to focus on producing high power by weight training or other low speed, high power exercises.
From the Power-Velocity line you can determine the maximum power, Pmax. The velocity at which the maximum power is obtained, is called the optimal velocity or Vopt.
Case study
Let’s take a look at the case study reported in this same paper to really get a good idea of how this works in practice. Player C and D are two elite rugby players who have a very similar 20m time, as well as a similar Pmax. However, you can see that their force-velocity profiles and ratio of force-velocity profiles are quite opposite.
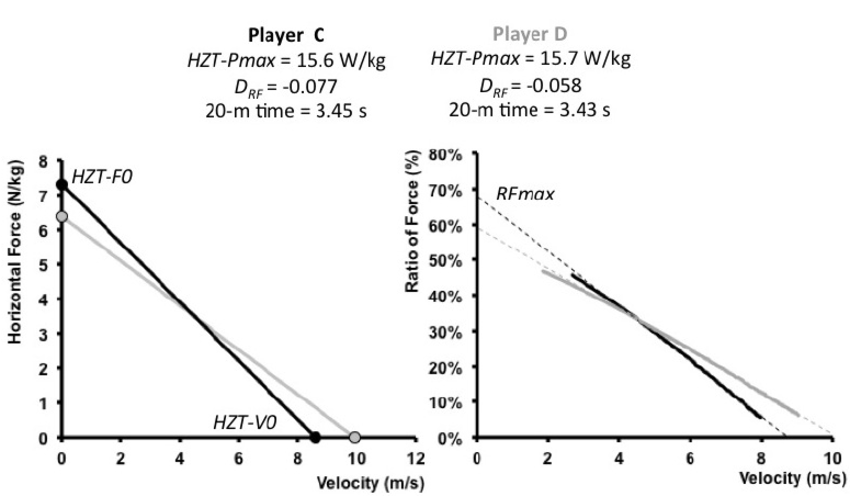
Player C has a higher F0 value, so he shows a higher horizontal force production at the beginning of the sprint. This is notably due to his higher effectiveness of ground-force application, as is reflected in his RFmax.
However, it is player D that wins the race!
While player D takes a slower start due to a lower F0, once the players reach a velocity higher than 4 m/s, it is player D who shows better horizontal force production.
He manages better to keep up his horizontal force production and thus reaches a higher theoretical maximal velocity, V0.
This is clearly visible in their DRF values: the rate of decrease in ratio of force of player C is more negative than player D, meaning that compared to player D the higher initial effectiveness of player C decreases at a greater rate as speed increases.
As you can see we have two athletes with almost identical 20m times but who require a very different training approach. Not taking an individual approach to optimizing their performance could have huge implications. Adopting the same training program for both athletes would result in suboptimal results for them.
In short, an individualized approach which you could deduct from the FVP profiles, will help your players to train optimally and improve their sprint timing. It could also avoid injuries or at least lower injury risk by not exposing them to unnecessary workload. For example, player D may focus less on intensive sprints but more on strength and horizontal strength work and thus reduce the risk for sprinting-related injuries.
Why should I use Force Velocity Power profiling?
1. You get better information
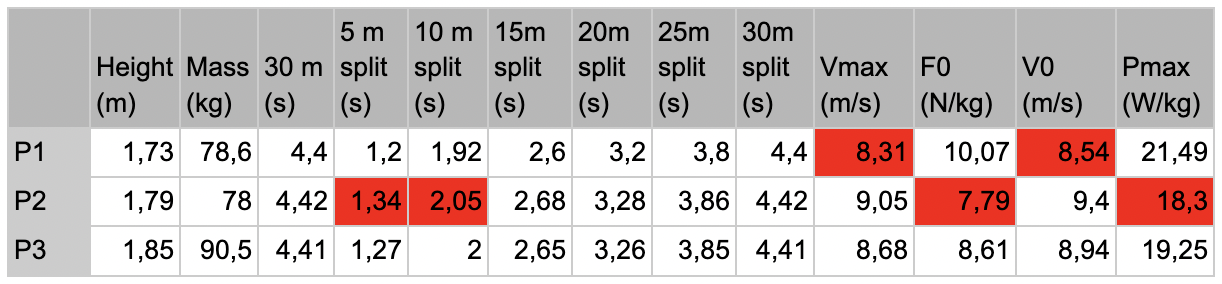
Simply timing a sprint would provide you with insufficient information. Three athletes can have the same total time of a 5 m or a 30 m sprint, but their profiles may vary, thereby needing a different approach. A quick study of their FVP profile would direct you towards what is needed to work on, for the improvement of their sprint time.
When comparing the theoretical maximal force (F0) and theoretical maximal velocity (V0) from FVP profiles of a French Elite rugby team, we see that player 1 has a very high F0 but a lower V0, while player 2 is the complete opposite. Player 2 has a slow start because he lacks force, but shows a high V0. Player 3 shows good values for both F0 and V0.
If they were to receive a training plan that’s focused on maximal velocity, player 2 would not improve as much as player 1 because that’s not what he needs to work on. He has a high velocity capability, so he would benefit by improving his force.
2. Different types of sprint testing could give different results
An athlete like player 2 from the example above would have a better performance on a longer sprint (e.g. 100 m) compared to the short 30 m sprint, because he has the time to make up for his slow start. Even a short sprint with a flying start would give a good result.
This shows you that just timing doesn’t give you the full picture, because different types of sprint testing would give you “different” results. A player could be deemed slow, while having high velocity capabilities! With FVP profiling, you get a better view on your athlete by reducing the effect of the type of test you conduct by using timings as input for a model.
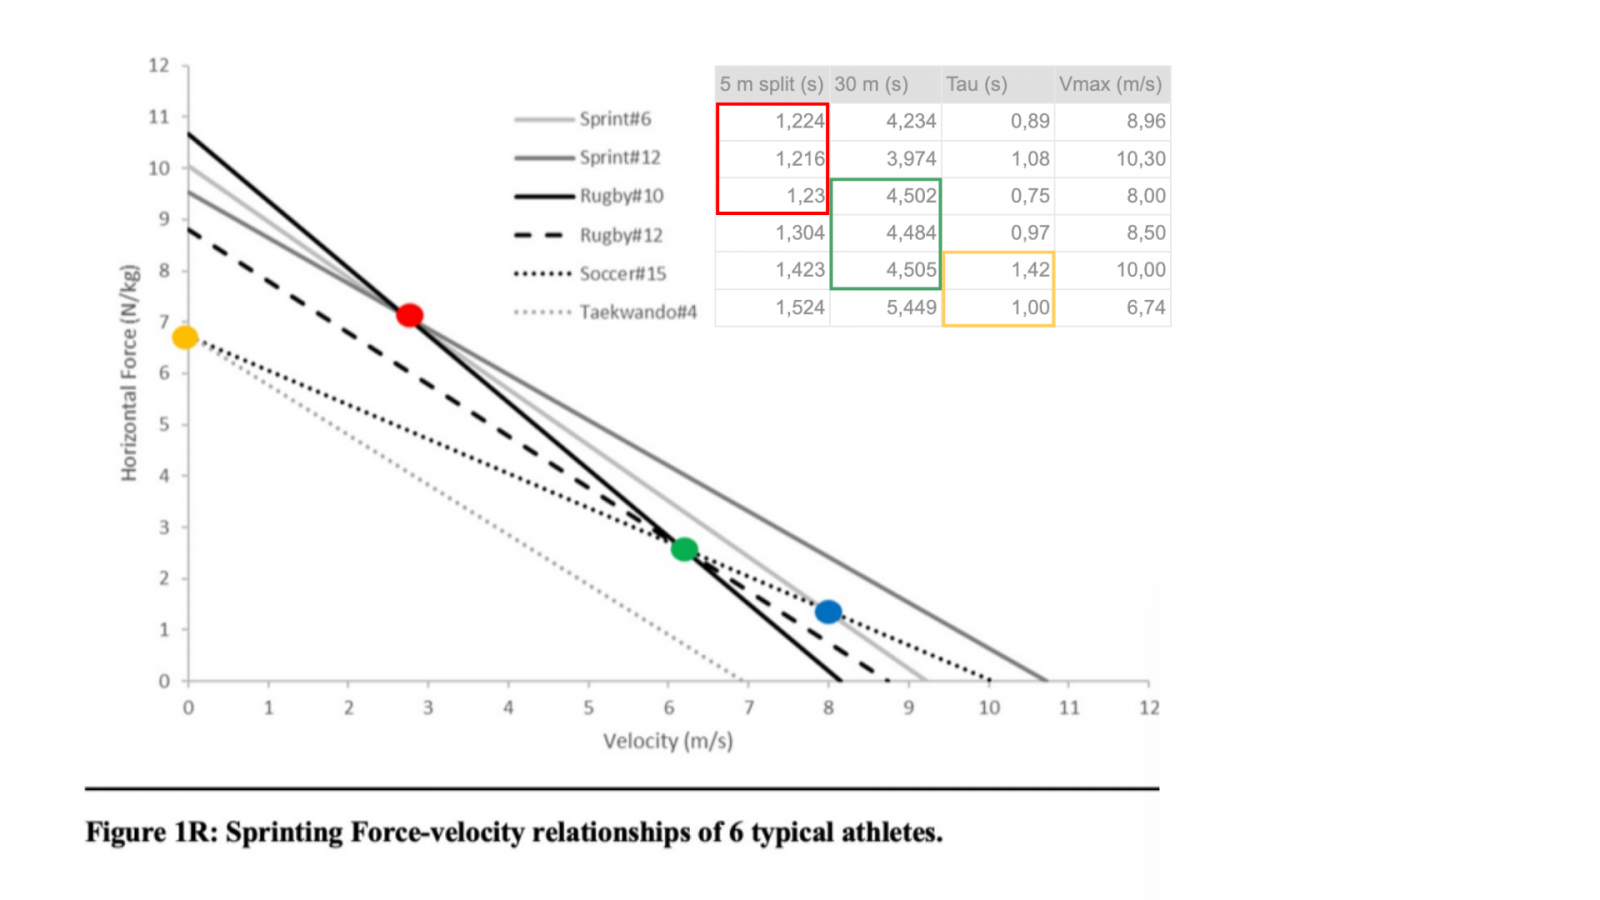
3. Different types of athletes can have the same split times
Even when you take the split times into account, you might miss differences in the performance characteristics of your athletes. It doesn’t necessarily mean that the same split times come from the same type of athlete who needs the same type of training. When we take a look at the picture below (Samozino et al., 2021), we see how different FV Profiles can intersect but still have a very different angle.
4. Split times do not differentiate between force production capability
There are people who would use the 5 m time as a proxy for horizontal force production, but it does not give us any information about the mechanical effectiveness of their force application (Ratio of Force). One player might have low overall strength but transfer it very effectively onto the ground, while another player might have greater strength but a low mechanical effectiveness, thus resulting in the same sprint times.
5. The FVP profile is an important factor in return-to-play
In the context of rehabilitation and return-to-sport processes, having the knowledge of an athlete’s pre-injury profile is of great value to enable an effective, sprint-oriented rehabilitation and return-to-play decision, as shown by Mendiguchia (2014, 2016, 2017).
6. Individualized training reduces unnecessary strain
Lastly and perhaps most importantly, individualizing the training for each of your athletes will optimize their training load and can lead to significant reductions in injury risk. For example an athlete with a Force deficit will have to do heavy lifting exercises and less intensive sprints and maximal velocity work. With less exposure to high velocity training, there will be a lower risk of sprint-related injuries.
7. Combined with vertical profiling you have a powerful view on your athlete’s performance
A FVP profile can also be constructed for vertical movements, i.e. jumping. Combining the horizontal and vertical profiling could help determine where the cause lies of for example a lower horizontal F0. Is it due to an overall deficit of lower-limb strength, as indicated by a low vertical Pmax? Or rather due to a deficit in the transfer of this strength in the specific horizontal push-off motion and thus more in the technical capability?
Limitation of Force Velocity Power profiling
While Force Velocity Power profiling has many benefits, there are a few limitations too.
1. No clear guidelines yet as to how to improve certain muscle output
The main limitation of this technique is that the profiling methods give you information about what specific muscle output should be developed but it doesn’t help you to construct an individualized training schema to put this into practice.
There is a lot of research underway about what you should do when you see a Force or Velocity deficit, which exercises are effective and which are not. At the moment of writing, there is no clear guideline on which exercises to use and how they can lead to a balanced training schedule.
Although there are some blog posts and videos available on which exercises might be able to compensate for either a force or velocity deficit, it is not as well documented as with the Force Velocity Profile in jumping. For jumping, there is research available from, among others, Jimenez-Reyes et al. (2017) and Simpson et al. (2021) where a one-size-fits-all approach was compared to an individualized training program. This does look very promising but unfortunately it has not yet been transferred to sprinting.
2. Research is still underway on determining the optimal sprint profile
An optimal FV profile exists for jumping, but we are looking forward to having the same for sprinting to extend the functionality of our web platform with. This would correspond to the best balance between force production capabilities at low and high velocities.
At the moment, you could draw conclusions on the progress of your players over time when you conduct sprint testing regularly and define their FVP profile. You could also compare your players to the average of your team or to other players.
A good first step in this was the paper by Matt Cross (Cross, 2017) on the optimal load for maximizing power during sled sprinting. In the most recent paper of Samozino (2021), he proposes individual optimal FV profiles for a given Pmax. This individual optimal profile depends not only on the Pmax but also on the sprint distance: the lower the sprint distance, the more the optimal FV profile is oriented to force capabilities and vice versa.
Conclusion
Force Velocity Power profiling is a powerful tool to individualize your players’ training and optimize their performance. There are numerous reasons to use it and the implementation has become much easier nowadays, thus taking away one of the limitations of this framework.
We believe that FVP profiling can be very useful for our users and that’s why we have decided to fully implement this into our web platform. We are confident that our users will gain time through this integration if they were already using FVP profiling and we hope to introduce more (potential) clients to this technique.
There are certainly future research opportunities to extend this technique and transfer it from the metrics and analysis stage to the next stages. Right now, it lacks the outline of an optimal sprint profile and clear guidelines on how to achieve that. Further development from Ledsreact would be automatic recommendations based on the Force Velocity Power profile of each athlete. This could even be extended to forming groups of athletes within your team that could benefit from the same training to make the training efforts more effective.
JB Morin said in his blogpost that “despite some necessary data collection/processing we fully acknowledge the sprint FVP approach brings a more informative picture than split times only” and we wholeheartedly agree. This is why we are on the frontier of making an effort to make the FVP profiling more accessible.
References
Cross, M. R., Brughelli, M., Samozino, P., Brown, S. R., & Morin, J.-B. (2017). Optimal load for maximizing power during sled sprinting. International Journal of Sports Physiology and Performance, 12(8), 1069-77. 10.1123/ijspp.2016-0362
Jimenez-Reyes, P., Samozino, P., Brughelli, M., & Moring, J.-B. (2017). Effectiveness of an Individualized Training Based on Force-Velocity Profiling during Jumping. Frontiers in Physiology, 7. 10.13140/RG.2.1.5017.7520
Mendiguchia, J., Edouard, P., Samozino, P., Brughelli, M., Cross, M., Ross, A., Gill, N., & Morin, J.-B. (2016). Field monitoring of sprinting power-force-velocity profile before, during and after hamstring injury: two case reports. Journal of Sports Sciences, 34(6), 1-7. 10.1080/02640414.2015.1122207
Mendiguchia, J., Martinez-Ruiz, E., Edouard, P., Morin, J.-B., Martinez-Martinez, F., Idoate, F., & Mendez-Villareal, A. (2017). A multifactorial, individualized, criteria-based progressive algorithm for hamstring injury treatment. Medicine and Science in Sports and Exercise, 49(7), 1482-92. 10.1249/MSS.0000000000001241
Mendiguchia, J., Samozino, P., Martinez-Ruiz, E., Brughelli, M., Schmikli, S., Morin, J.-B., & Mendez-Villanueva, A. (2014). Progression of Mechanical Properties during On-field Sprint Running after Returning to Sports from a Hamstring Muscle Injury in Soccer Players. International Journal of Sports Medicine, 35(08), 690-95. 10.1055/s-0033-1363192
Morin, J. (2017, December 13). A spreadsheet for Sprint acceleration Force-Velocity-Power profiling. JB Morin, PhD – Sport Science. https://jbmorin.net/2017/12/13/a-spreadsheet-for-sprint-acceleration-force-velocity-power-profiling/
Morin, J.-B., Edouard, P., & Samozino, P. (2011). Technical ability of force application as a determinant factor of sprint performance. Medicine and Science in Sports and Exercise, 43(9), 1680-8. 10.1249/MSS.0b013e318216ea37
Morin, J.-B., & Samozino, P. (2016). Interpreting Power-Force-Velocity Profiles for individualized and specific training. International Journal of Sports Physiology and Performance, 11(2), 267-72. 10.1123/ijspp.2015-0638
Morin, J.-B., Samozino, P., Murata, M., Cross, M. R., & Nagahara, R. (2019). A simple method for computing sprint acceleration kinetics from running velocity data: replication study with improved design. Journal of Biomechanics, 94, 82-87. 10.31236/osf.io/vgqzs
Samozino, P., Peyrot, N., Edouard, P., Nagahara, R., Jimenez-Reyes, P., Vanwanseele, B., & Morin, J.-B. (2021). Optimal mechanical force-velocity profile for sprint acceleration performance. Scandinavian Journal of Medicine and Science in Sports. 10.1111/sms.14097
Samozino, P., Rabita, G., Dorel, S., Slawinski, J., Peyrot, N., Saez de Villareal, E., & Morin, J.-B. (2015). A simple method for measuring power, force, velocity properties, and mechanical effectiveness in sprint running. Scandinavian Journal of Medicine and Science in Sports, 26, 648-658. 10.1111/sms.12490
Simpson, A., Waldron, M., Cushion, E., & Tallent, J. (2021). Optimised force-velocity training during pre-season enhances physical performance in professional rugby league players. Journal of Sports Sciences, 39(1), 91-100. 10.1080/02640414.2020.1805850